
Maps, graphs and diagrams
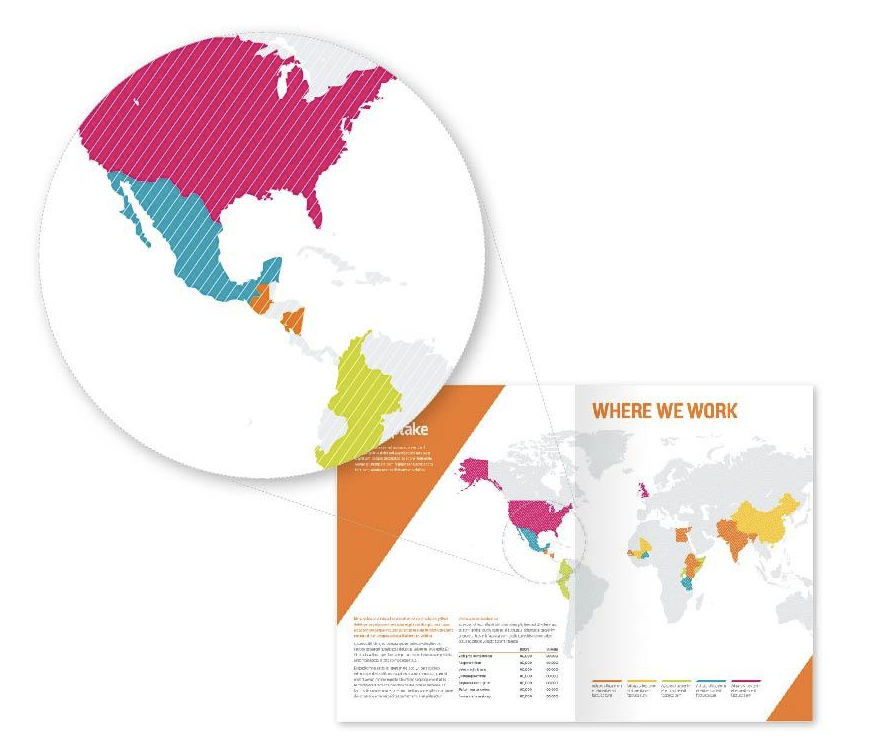
Use Brooke’s colour palette when creating maps, graphs and diagrams.
We are steadily adding infographics to Webdam - see this folder.
If you are comissioning a designer to create a new infographic, please share the brand style guide with them, and include a request to deliver the design files on completion of the project. This means we can keep them and make tweaks for future use.